HDAFU Tables, leveraging past data, locate value bet clusters, decipher bookmakers’ odds manipulation, and show the correlation of odds changes, offering bettors a foundation for profitable decision-making.
Unravel the bookmakers’ code, and instead of predicting outcomes, you’ll anticipate profit margins.
THE ROLE OF INFLECTION POINT CURVES
Deciphering Betting Trends
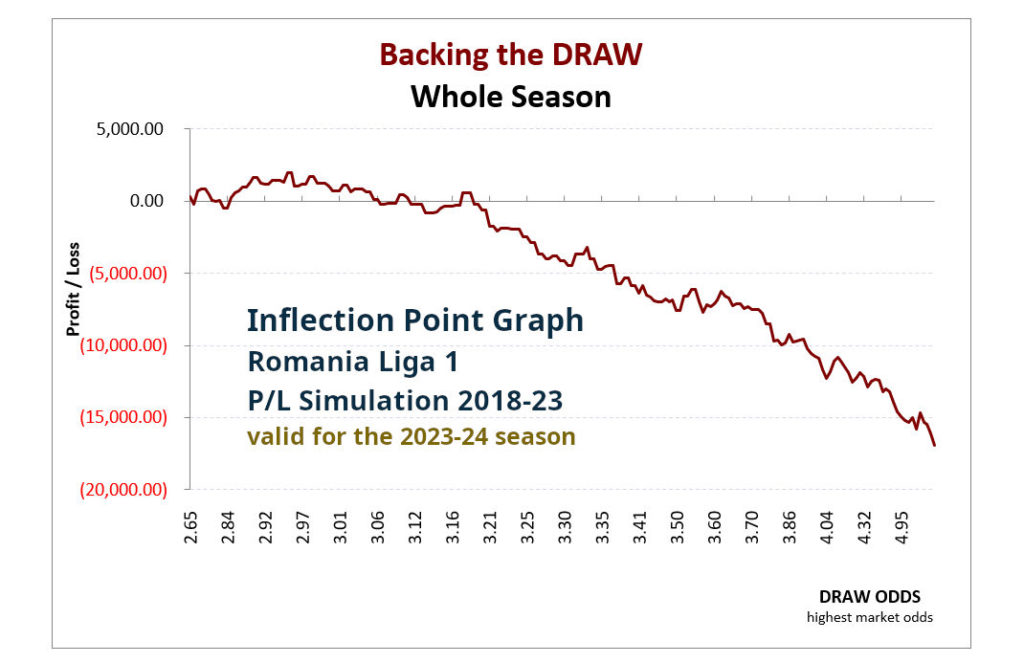
Inflection Point curves serve as a crucial tool for navigating the complex betting landscape.
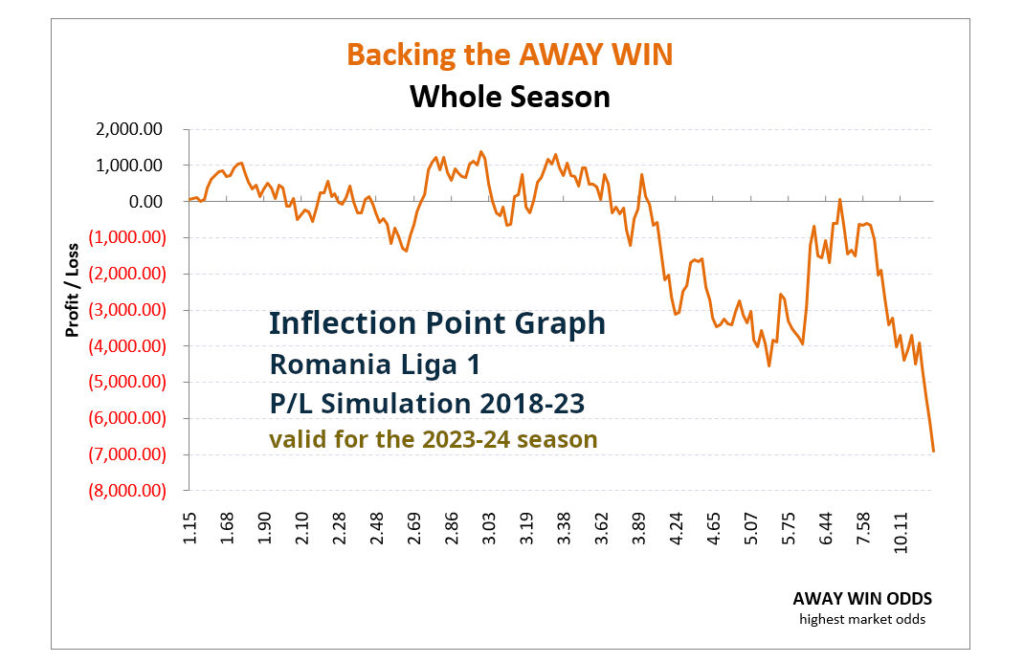
Presented in the Romania Liga 1 HDAFU Tables (Home Draw Away Favourite Underdog P/L simulations), these curves identify key shifts where potential profits become losses and the other way round.
Such shifts arise when bookmakers tweak odds to ensure an even spread of bets across possible outcomes.
By manipulating public sentiment and adhering to the rule that probabilities must total 100%, they inadvertently create scenarios where some outcomes are priced too high or too low.
Informed bettors spot and exploit these odds discrepancies, which differ from one league to another.
DECODING MARKET-INFLUENCED BOOKMAKER ODDS
The Oddsmakers’ Rubik Cube
The crafting of bookmaker odds isn’t just about calculating probabilities, it’s a strategic balancing act influenced by the whirlpool of market dynamics.
Bookmakers deftly tweak odds to keep their books balanced and their profits secured.
This artful manipulation is vividly captured in Soccerwidow’s HDAFU Tables’ P/L curves, pinpointing instances of odds juggling.
With this clarity, insightful punters can find over- and under-priced odds clusters unique to each league, effectively gaming the system to their advantage.
NOVEL INSIGHTS INTO BETTING
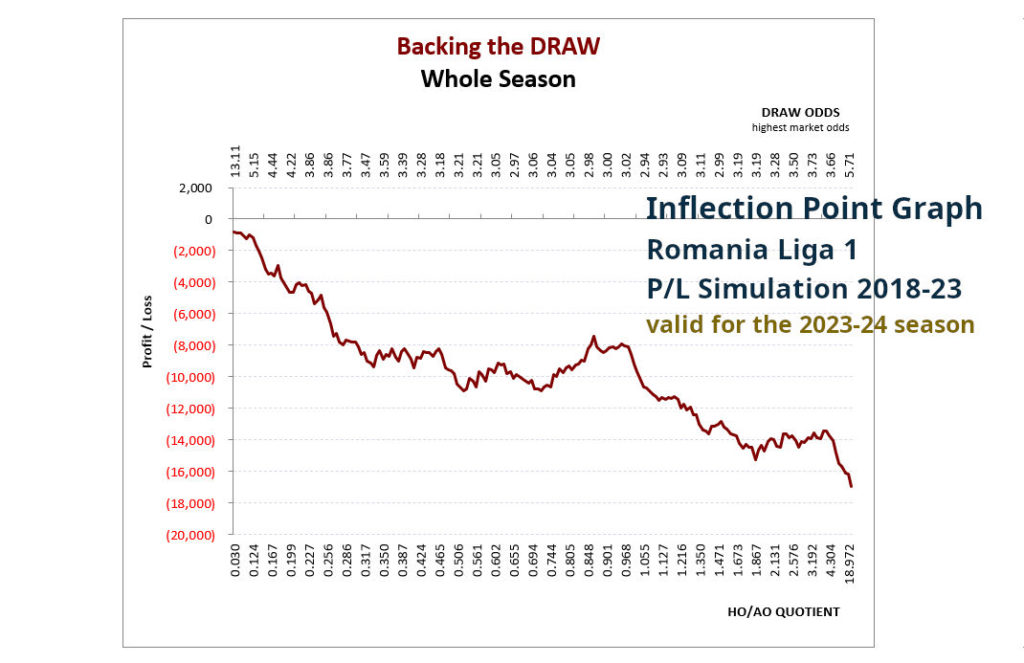
Understanding the HO/AO Quotient
When exploring the realm of 1X2 betting, one will inevitably encounter the significance of the HO/AO Quotient.
At its core, this represents the division of “Home Odds by Away Odds”.
It serves as a pivotal tool for any budding bettor. Conventional 1X2 betting presents three outcomes to consider, but the HO/AO Quotient simplifies this landscape into a more digestible binary format.
Here’s a practical example: faced with Draw odds, like 3.2, you might ponder if these favour the home or away team.
With the guidance of the HO/AO Quotient, one can easily dissect P/L curves based on the true prowess of the contending teams, paving the way for more informed betting choices.
READING BETWEEN THE ODDS
Betting Dynamics
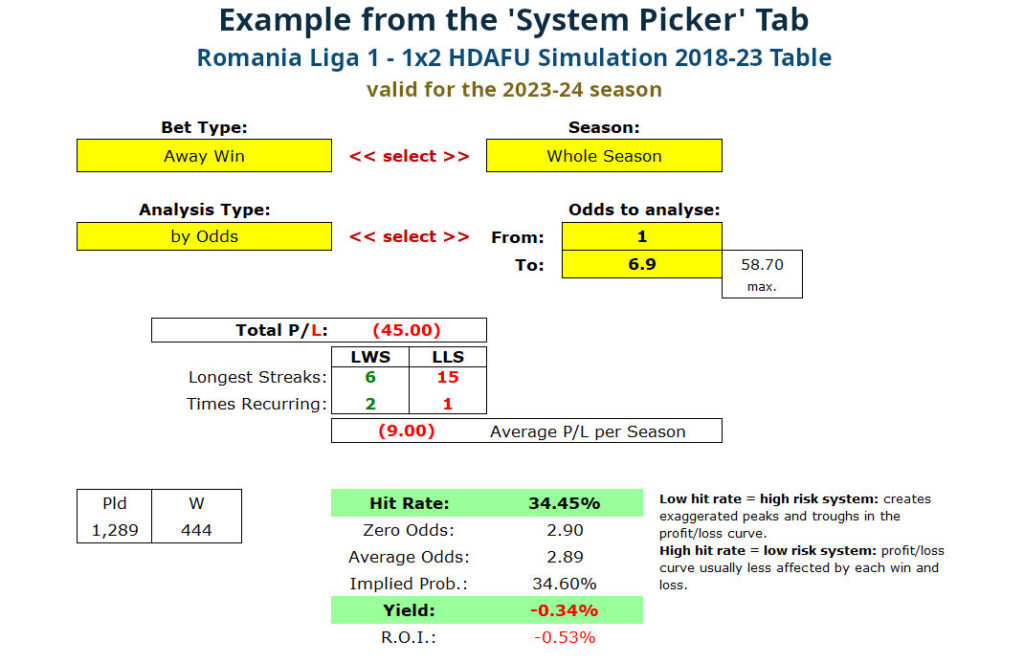
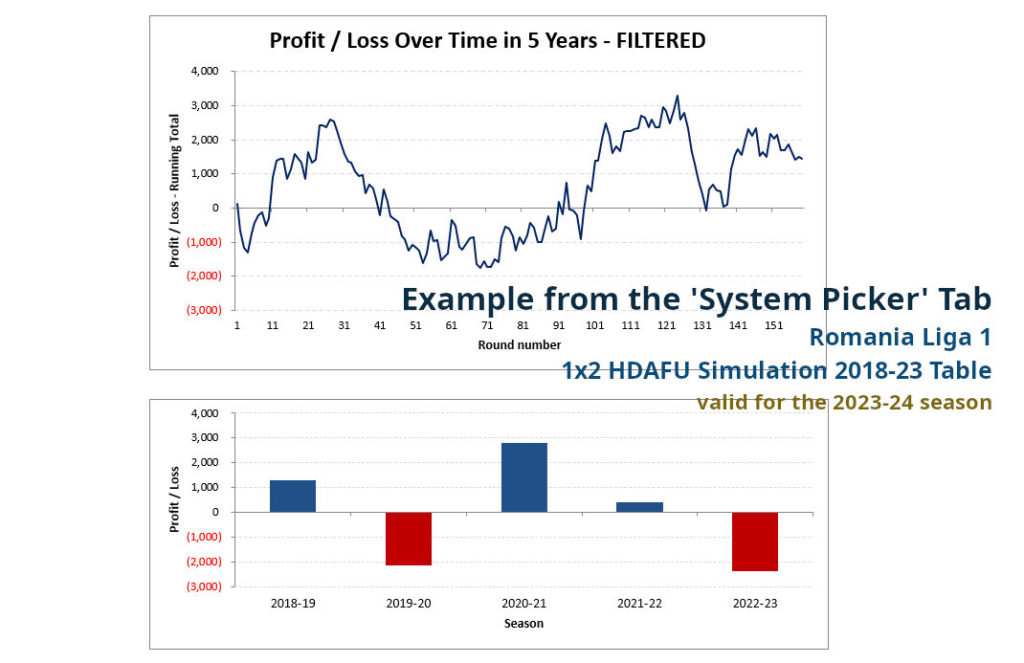
The System Picker Tab offers a detailed five-year profit/loss simulation.
A curious trend emerges in Romania Liga 1’s Away P/L curve over the past five years. A closer inspection reveals that ‘Backing the Away Win’ hovered around the break-even point until odds of 3.9, took a steep drop up to 5.35, and then returned to equilibrium.
While the 5.35 to 6.9 segment showed profits, it only had 143 matches spread sporadically across five years, with notable losses in 2018-19 and 2022-23.
Meanwhile, the 3.9 to 5.35 segment had 250 matches and witnessed escalating losses each season.
Oddsmakers seem under external pressures, potentially linked to the pandemic seasons. The away win percentage, typically steady, varied substantially over five years, ranging from 19.68% (2021-22) to 23.81% (2019-20)—a significant over 20% deviation.
ROMANIA LIGA 1 INSIGHTS
A Paradise for Layers
Dive into Romania Liga 1’s HDAFU Tables, and a clear pattern emerges.
Over half a decade, we’ve witnessed startling losses: home teams shed 5,301 units, draws 17,038 units, and away teams 6,191 units.
Even the favourites weren’t spared, with a loss of 443 units, and the underdogs? A staggering 11,049-unit drop.
This data suggests that the league is more suited for professional layers than conventional backers.
Intriguingly, there are teams that consistently underperform when backed.
The real eye-opener, however, lies in the Inflection Point graphs, indicating the potential goldmine in laying the draw, especially when distinguishing between season halves.
Our product page offers a brief overview, but the Romania Liga 1 HDAFU Tables’ true essence remains vast and expansive. Dig deeper to reveal a world of intricate strategies, enlightening nuances, and specific league patterns waiting to be leveraged.
As Soccerwidow’s HDAFU Tables elevate your betting game, it’s imperative to always intertwine your strategies with the golden threads of responsible gambling.