


Soccerwidow’s Cluster Tables for the Italy Serie A are an analytical tool used to analyse and predict Over/Under outcomes based on historical data. They organise data into clusters or groups with similar characteristics, allowing punters to identify patterns and trends. With the help of the these clusters, punters can calculate the probabilities and determine fair odds, aiding in more informed betting decisions.
This method is particularly valuable for spotting value bets, where the potential return outweighs the risk according to the statistical likelihood of an event occurring.
Want to fully understand Cluster Tables and how to apply them? Get our Fundamentals of Sports Betting course book.
In Over Under betting, we don’t just watch the game; we delve into a world of probabilities and numbers.
THE GAMBLE ON UNDER ‘X’ GOALS: A RETROSPECTIVE
A Five-Year Odyssey
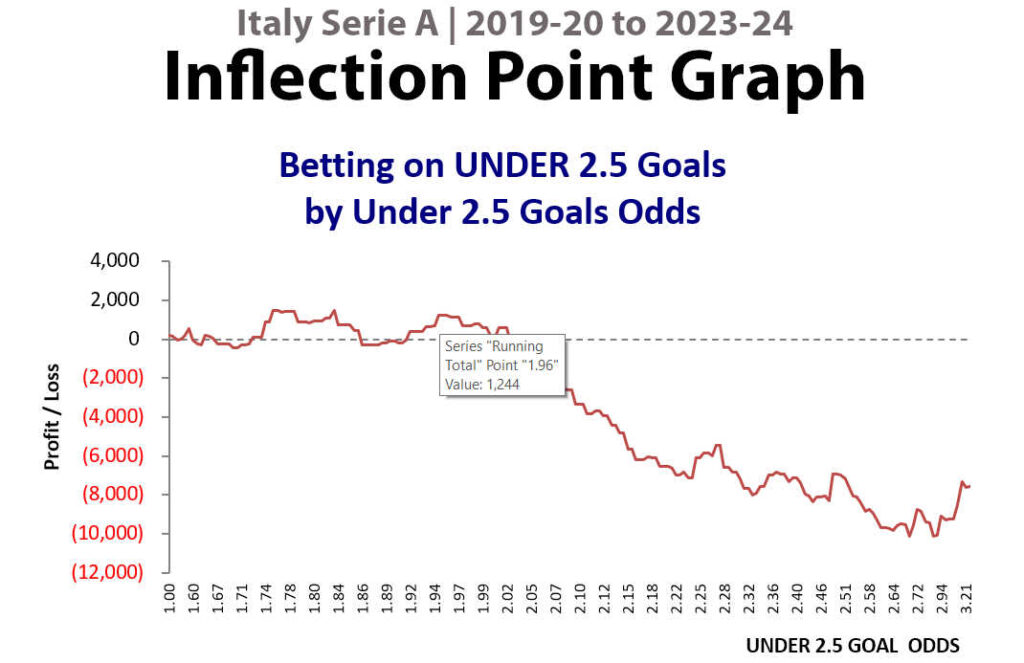
The Inflection Point Graph provides a clear visualisation of the Profit/Loss scenario for anyone who ventured to wager 100 units on every single Under 2.5 Goals bet over a span of five seasons.
This graph categorises odds from the minimal, under 1.50, extending to those over 3.0, offering a comprehensive view of betting dynamics.
Strikingly, up to odds of 1.96, returns would have roughly balanced out at zero, indicating that bookmakers have priced Under 2.5 goals with a fair reflection of probabilities up to 50%.
This finding highlights a tendency among Italian punters to prefer wagers on Under 2.5 goals once the odds surpass even, compelling bookmakers to adjust odds downward in response.
Across these five seasons, with 1,900 bets laid out, each staked at 100 units, a total of 190,000 units were gambled, culminating in a loss of approximately 10,000 units.
This translates to a bookmaker’s yield of about 5% solely from this type of bet, underscoring the precision of their odds-setting strategy.
DECIPHERING GOAL BETTING DYNAMICS
Exploring Odds Interplay
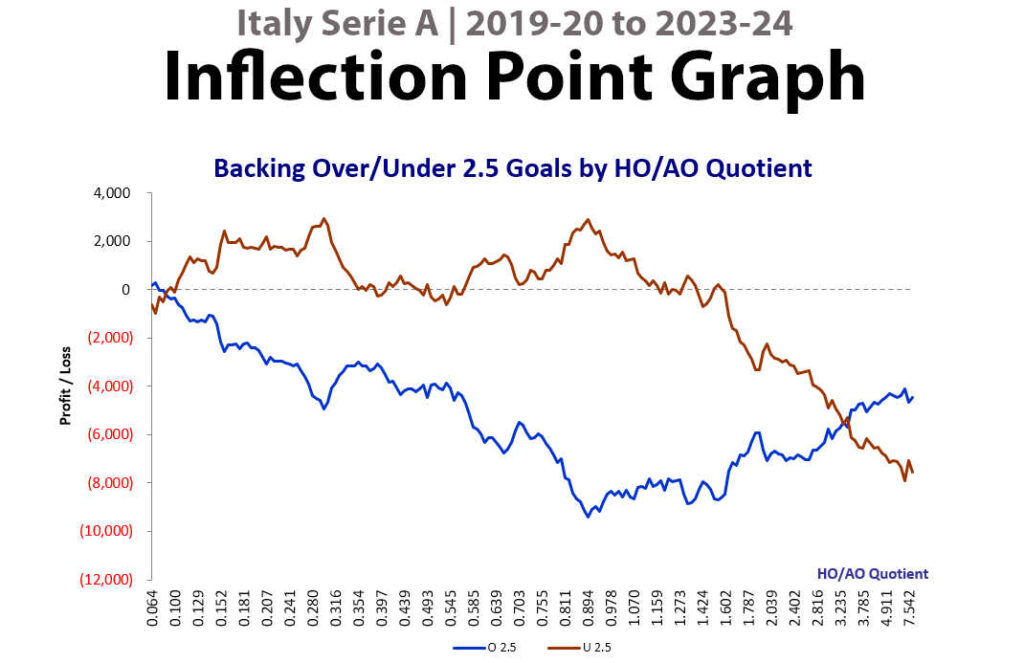
This Inflection Point Graph displays two distinct curves: the Over 2.5 goal bets (
As if adhering to the laws of physics, where one line ascends, the other descends. But why is this so? Let’s delve into a bit of educated conjecture.
Probabilities in betting must always sum up to 100%.
Thus, if the probability of Under 2.5 goals stands at 40% (equivalent to odds of 2.5), then what would be the probability of Over 2.5 goals?
Following adjustments by bookmakers, if Under 2.5 goals are priced at a probability of 45% (translating to odds of 2.22), the Over 2.5 goals probability adjusts correspondingly.
This graph is particularly organised by the HO/AO quotient (Home odds divided by Away odds), grouping matches by comparable team strength. Without delving too deeply into technicalities, let’s observe: the Under 2.5 goals curve declines until reaching a HO/AO quotient of 0.894, indicative of matches where the favourite is at home, while the Over 2.5 goals Profit/Loss curve hovers around zero.
What can we infer from this? The answer lies in your hands. Engage with the graph, draw your conclusions, and challenge your understanding of the dynamics at play.
ANALYZING VALUE BETS IN SERIE A
Bet Smartly
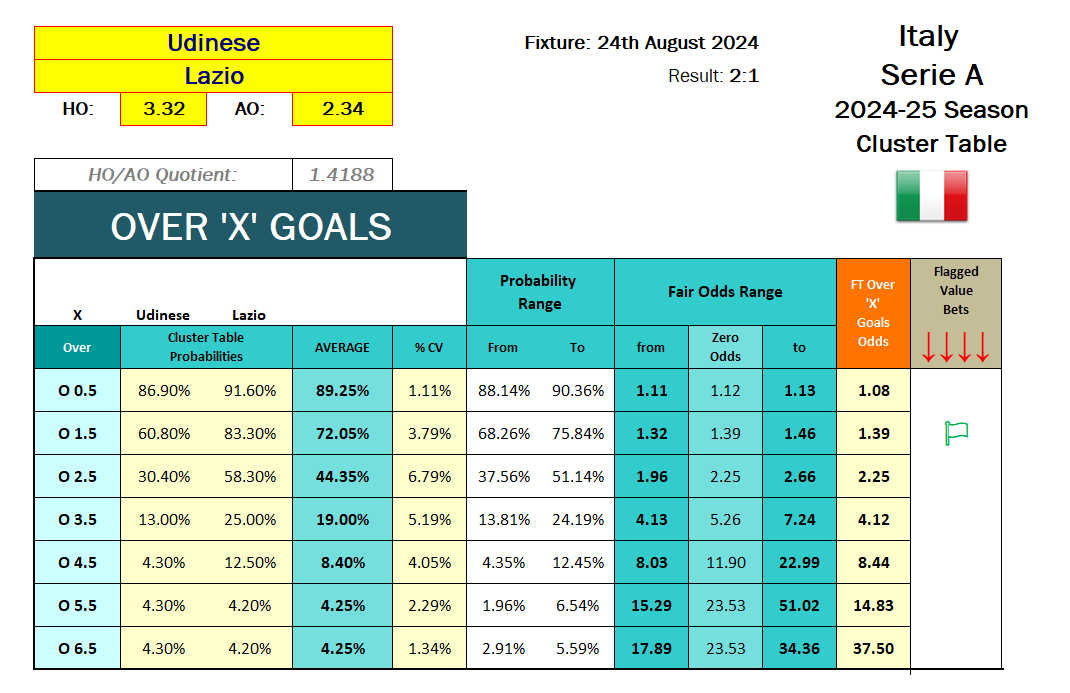
Let’s analyse the Udinese vs Lazio match on the 24th August 2024, with an HO/AO Quotient of 1.4188.
Using the Inflection Point graph as our guide, would you suspect the value lies with the Over or Under 2.5 goals? Indeed, it seems the value should favour the Over 2.5 goals.
However, a closer inspection of the calculations reveals a twist: the Over 2.5 bet, whilst looking attractive, isn’t flagged. It’s pegged at odds of 2.25, precisely at the Zero odds mark. But here’s the kicker—the actual probability of winning this bet stands at a modest 44.35%.
Conversely, the safer Over 1.5 goals bet is highlighted in white, offering a more reassuring 72.05% chance of success.
Also flagged are the Under 2.5 and Under 3.5 goals bets. While the Under 2.5 bet fits well within the fair odds range, it lies below the Zero odds, indicating a likely loss over time—as also depicted in the Inflection Point chart. The more prudent choice? The Under 3.5 bet.
For those who heeded this advice and backed both the Over 1.5 and Under 3.5 goals, congratulations are due. The match concluded at 2:1, making both bets winners.

GOALS GALORE: UNDERSTANDING ODDS
Strategic Betting
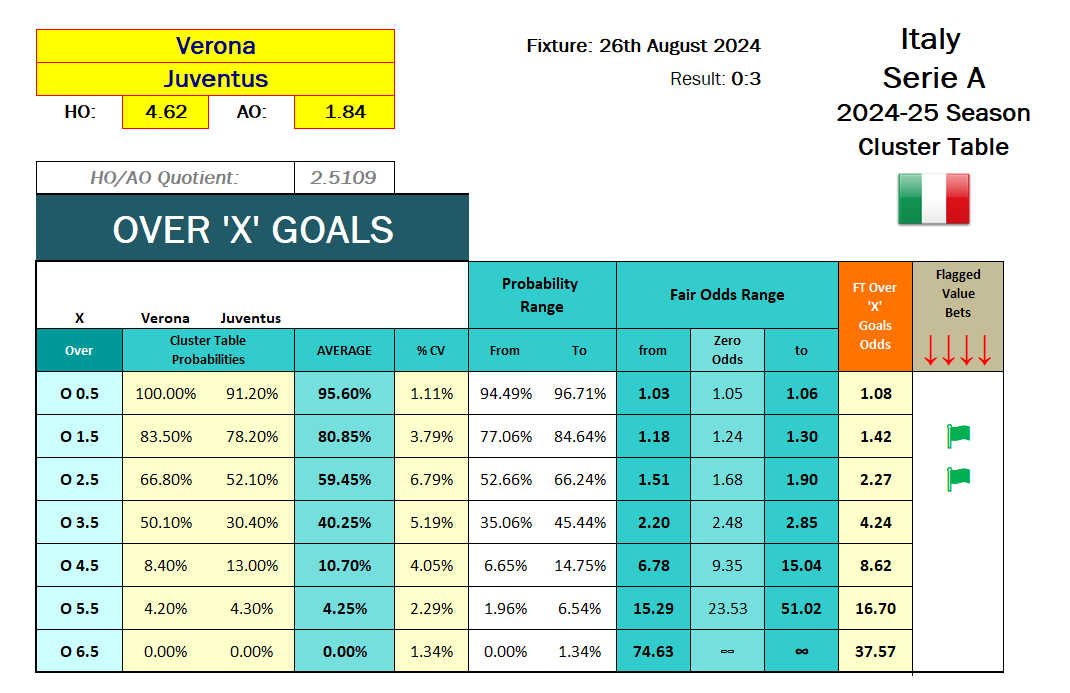
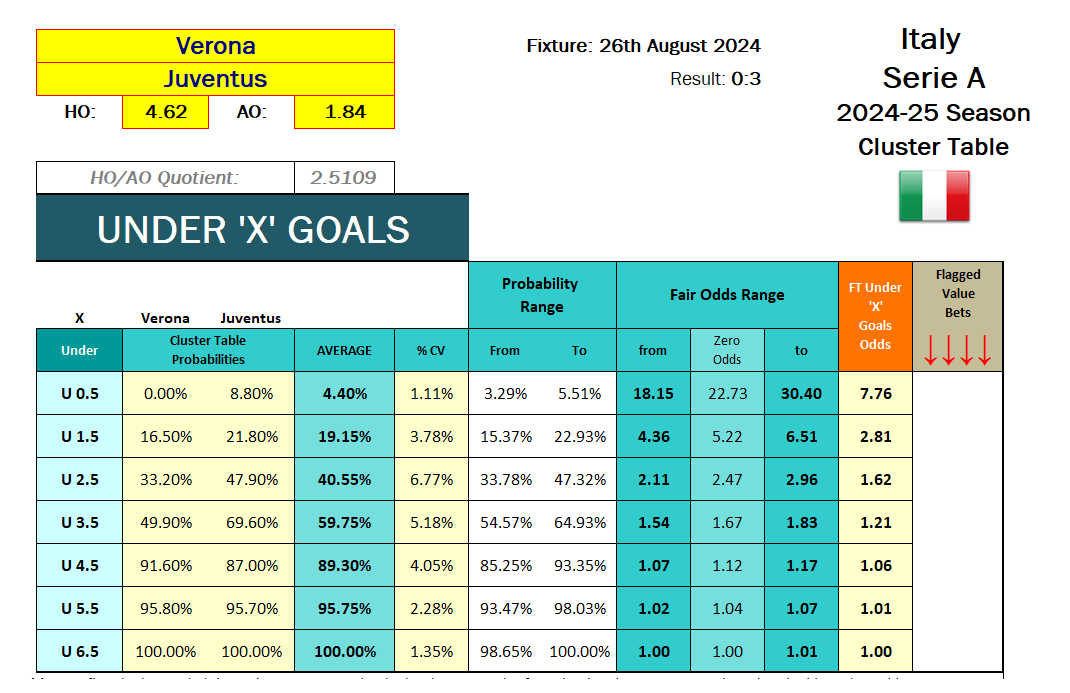
Verona vs Juventus, 26th August, HO/AO Quotient: 2.5109, signalling that the favourite is the away team.
Curious about what the Inflection Point graph suggests? If you’ve not yet checked, now’s the time to scroll up and take a peek.
The graph hints that the Over 2.5 goals bet might hold value, while the Under 2.5 might not. Let’s see if that holds true.
Flagged as value bets are the Over 1.5 Goals at odds of 1.42—well above the fair odds range—and the Over 2.5 Goals at odds of 2.27, also exceeding the expected odds.
These are marked as clear Value Bets, boasting winning probabilities of 80.85% for the Over 1.5 and 59.45% for the Over 2.5.
It’s important to remember that a bet just by being termed a ‘Value Bet‘ doesn’t ensure a win; betting always involves risks. For this match, there was about a 20% chance it might end Under 1.5 goals and roughly a 40% chance of concluding Under 2.5 goals.
However, the outcome of this case study match ended favourably: a decisive 0:3 victory for Juventus, affirming the predictions of our value bet analysis.
BOOST YOUR BETTING POTENTIAL
Advance Your Betting Knowledge
Dive into the world of professional betting with our essential guide, “Fundamentals of Sports Betting”. Explore the complete potential of our Cluster Tables by understanding their statistical foundations.
This detailed course book elucidates key betting principles such as standard deviation, odds ranges, and the conversion of probabilities into odds, equipping you with the knowledge required to bet with expert precision.
Without this essential understanding, the significant benefits of Cluster Tables remain hidden.
Enhance your betting skills and broaden your strategic insights. Take action now — Get your copy today!