Leveraging historical data, HDAFU Tables identify value bet clusters, decipher bookmakers’ odds manipulation tactics in the France Ligue 1, and elucidate how odds shifts influence other outcomes, aiding bettors in strategic decision-making.
Betting isn’t a game of chance. With the right system, it’s a finely tuned algorithm of profit.
DISCOVER THE HIDDEN PATTERNS
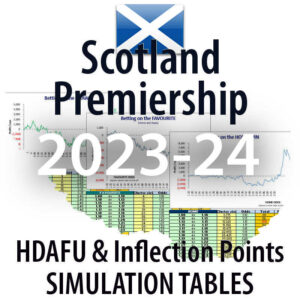
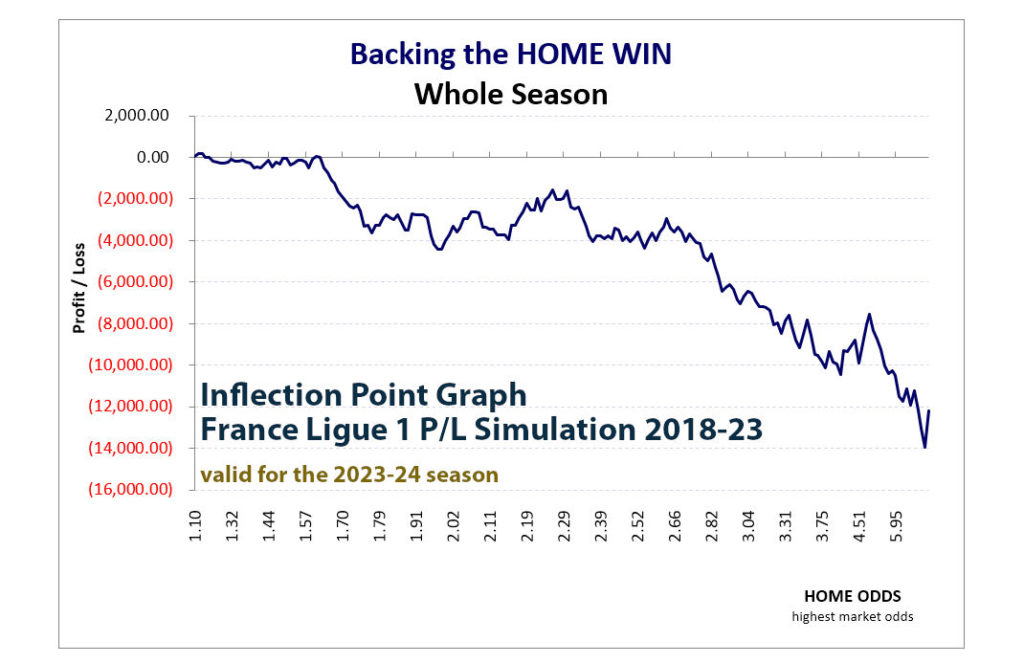
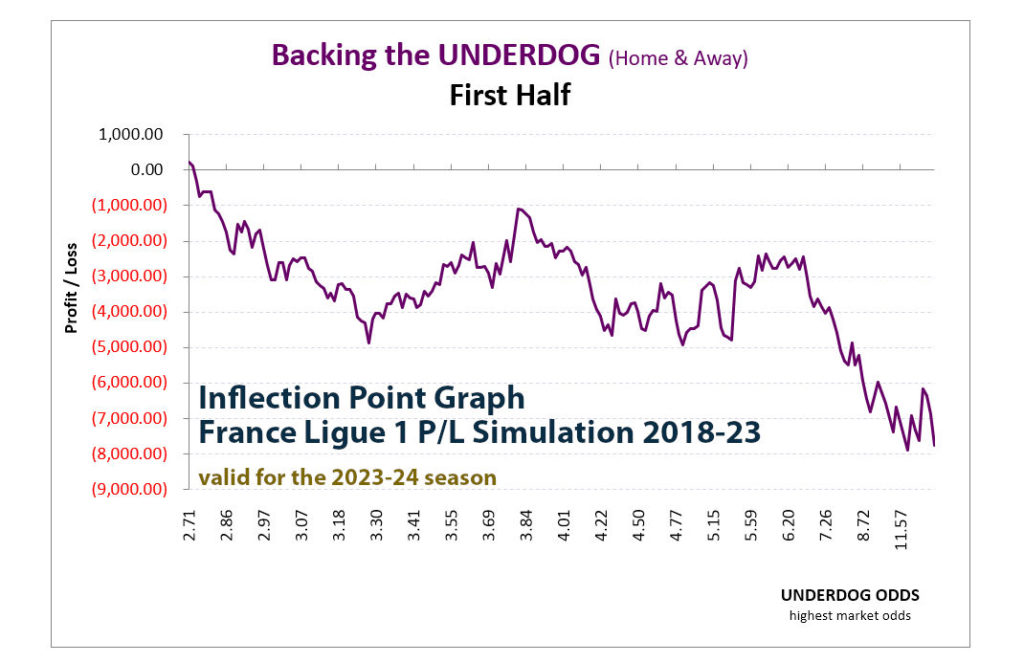
Decoding Inflection Points
Decipher the patterns behind the Profit/Loss shifts with the help of Inflection Point graphs in HDAFU Tables (Home Draw Away Favourite Underdog P/L simulations).
These graphs visualize the ebb and flow of profit and loss, indicating the bookmakers’ sweet points.
However, when the odds for one outcome are manipulated, it creates undervalued opportunities elsewhere, as the probabilities always add up to 100%.
Bettors can leverage these patterns to identify and exploit overvalued and undervalued odds clusters, outsmarting the bookmakers.
STRATEGY OF THE ODDSMAKERS
The Market’s Influence
Bookmakers’ odds are not mere reflections of probable outcomes, but strategic calculations influenced by market dynamics.
The odds-setting process is a complex choreography, designed to balance bets and protect bookmakers’ profits.
This game of oddsmakers is visualised in the P/L curves within Soccerwidow’s HDAFU Tables, at which odds or HOAO quotients bookmakers pull the strings and manipulate odds to steer public opinion.
Punters aware of these tactics can seize the reins, identifying over- and under-priced clusters specific to each league, and turning the tables to their advantage.
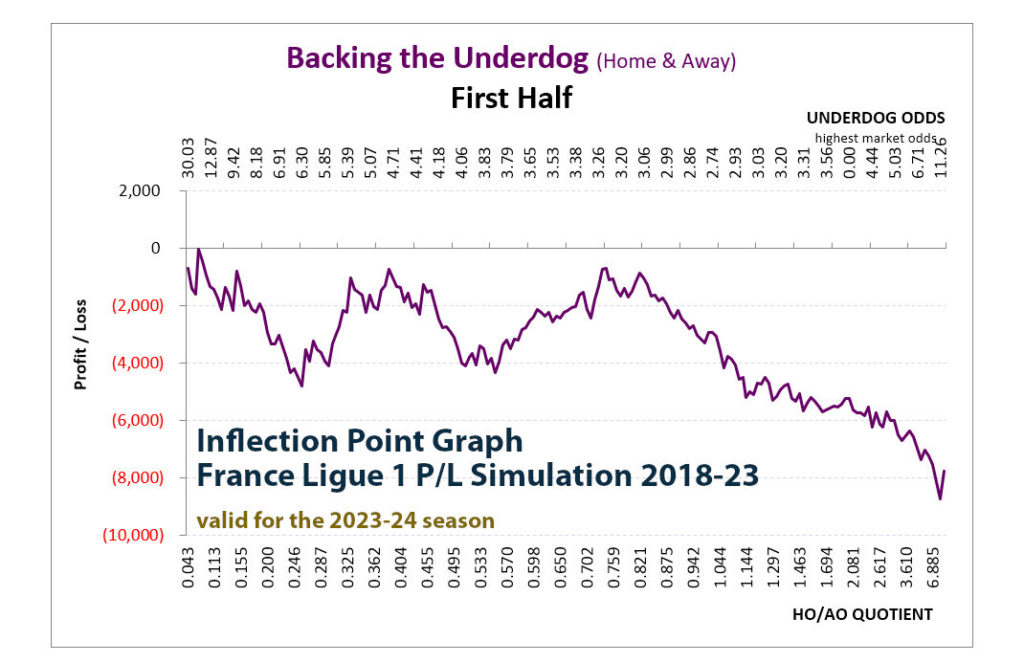
HO/AO QUOTIENT: A LAYERED PERSPECTIVE
Strategic Betting
The HO/AO Quotient, representing the ratio of Home Odds to Away Odds, is a key tool within the HDAFU tables.
This metric transcends the boundaries of individual odds, offering a combined perspective that enables historical comparison of matches.
Inflection point graphs by odds alone place the underdog invariably on the high odds side. The HO/AO quotient, however, distinguishes between home and away underdogs, offering more nuanced insights.
This understanding can be pivotal in revealing bookmaker tactics and identifying profitable betting clusters.
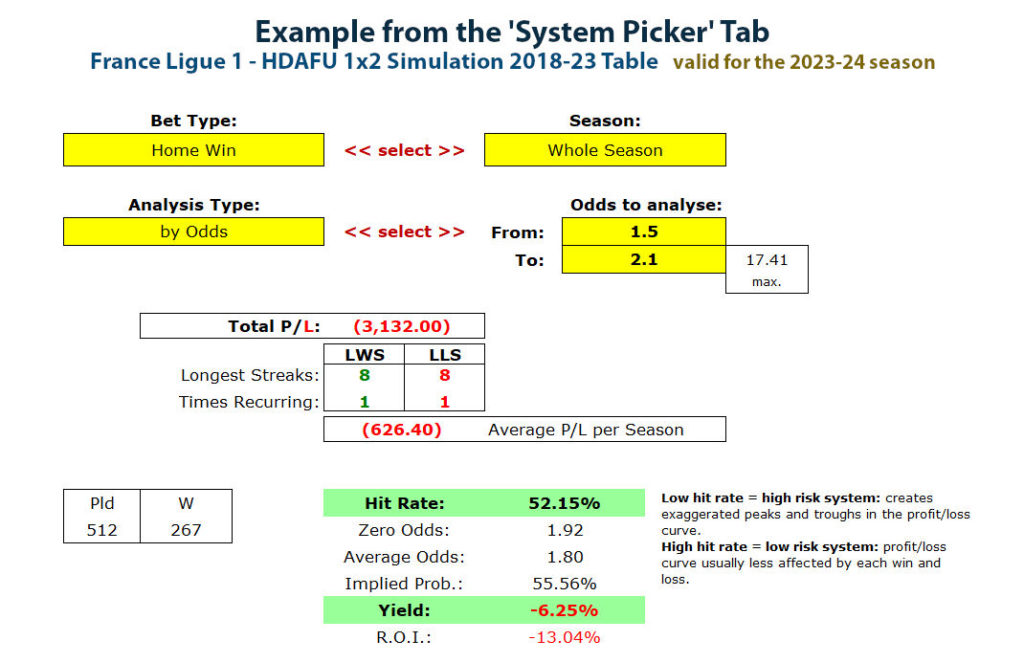
HARNESS THE POWER OF THE SYSTEM PICKER TAB
Understand Patterns
Unearth the success of your betting strategies using the System Picker Tab. It simulates a five-year profit/loss journey, helping to discern successful and failing systems by filtering via bet type, season, and analysis type post Inflection Point graph analysis.
For instance, if you’re a France Ligue 1 aficionado and consistently back home wins with odds between 1.5 and 2.1, you’d notice a net loss over the last five years. Your Longest Winning Streak (LWS) might extend to 8 victories, but, interestingly, so could your Longest Losing Streak (LLS).
By the way, this cluster may become part of a profitable Laying strategy.
The tab includes P/L trajectory curves for your chosen cluster over a half-decade, giving season-wise profit/loss and underlying numerical data. And there’s much more to explore.
UNCOVERING THE GOLD IN THE DETAILS
A Tale of Profits and Losses
The HDAFU Tables reveal insightful information about betting strategies in Ligue 1.
For example, while backing every draw in France Ligue 1 with a 100-unit stake over the past five seasons would have led to a 4,142-unit loss, specific team strategies would have painted a different picture. For instance, betting 100 units on each away game draw for Reims over the same period would have brought a 3,887-unit profit.
On the other hand, backing all home wins for all teams would have resulted in a significant 12,210-unit loss. However, consistently backing Rennes would have earned a 2,245-unit profit over five seasons, even though only three of these were profitable. However, the loss years were not overly damaging, maintaining overall profitability.
Our showcased insights only scratch the surface of Soccerwidow’s HDAFU Tables. Delve deeper to unearth layers of value and strategic pathways. Every league presents its own set of challenges and opportunities. With the HDAFU Tables at your side, you’re equipped to decode, devise, and dominate.
Yet, as you chart this sophisticated terrain, always anchor your betting decisions in responsibility and wisdom.