Over/Under betting offers a simplified approach because it concentrates on the total number of goals scored in a game, rather than predicting specific outcomes like which team will win, lose or draw.
Bettors only need to determine whether the total goals will be over or under a predetermined threshold set by bookmakers.
This makes it easier to analyse and predict trends using historical data, as the focus is on goal patterns rather than the complexities of individual match outcomes.
The Cluster Tables themselves may not be immediately accessible for beginners in sports betting, as they involve a fair amount of mathematical and statistical analysis. However, they can become suitable for beginners if they are willing to work through a relevant course book or guide that explains how to use the Cluster Tables effectively.
The course book is designed to cater to both beginners and experts, as it challenges common beliefs and perceptions about sports betting. By working through the course book, beginners will gain a solid foundation in betting concepts, statistical analysis, and how to use the Cluster Tables to make informed decisions.
In summary, while the Cluster Tables might initially seem complex to beginners, they can become suitable and valuable tools for those willing to invest time and effort into understanding them through a course book or guide.
The HDAFU 1X2 Tables and Cluster Tables are two distinct products, not only because one is designed for 1×2 betting and the other for Over/Under betting, but mainly because one focuses on system betting (HDAFU tables) and the other on value betting (Cluster Tables).
This doesn’t mean system betting, when done correctly, lacks ‘value.’ It certainly does! No system in this universe can make money without a mathematical advantage on your side. However, we often receive this question, so here’s a brief explanation of the differences between ‘system betting’ and ‘value betting.’
System betting involves a predetermined selection of bets that, when combined, represent a profitable betting scenario, giving the gambler an edge. However, system betting requires immense discipline and follow-through from start to finish (or to a suitable profit closure point), ideally without skipping any bets in the system. For example, if the system requires placing 17 bets throughout the season based on specific criteria, you should place them all for optimal results!
In 2015, a German HDAFU tables user shared a simple system involving backing the underdog in all 17 home games of SV Hamburg with 100 unit flat stakes. He updated us regularly, but after three consecutive losses, he abandoned the system due to emotions. If only he had persisted, he would’ve received a substantial return! System betting is suitable for those who can detach their emotions or use a bot for unemotional, automated betting.
A significant challenge with system betting is that bookmakers eventually adjust for the system, rendering it unprofitable. This means bettors must constantly review their strategies.
Value betting, on the other hand, is an entirely different approach and is considered one of the best techniques for profiting from betting. A value bet occurs when the chances of winning are better than the odds suggest, and all you need to do is capitalise on this situation. Unlike system betting, value betting doesn’t require constant attention, and there’s no pressure to place bets. Fixture lists can be perused at your leisure.
Value betting relies on identifying overpriced or underpriced bets, diversifying risk through a weekend portfolio, and employing a proper staking plan. When calculations are accurate, each round of matches should yield a positive return, barring exceptional circumstances.
Ultimately, you must decide: Is system betting more suitable for your needs and personality, where you stick to the system without much calculation, or do you prefer value betting, calculating each match and compiling a bet portfolio for each round? Can you commit to following the same system for an entire season without deviating, or would you rather experiment as you go along?
Your answer will determine whether you prefer HDAFU Tables (system betting) or the Course book and Cluster Tables (value betting). Don’t choose based on 1×2 or Over/Under betting, as we haven’t published a course book on 1×2 odds calculation (value betting) or Over/Under inflection point tables (system betting) yet.
If you’re a wizard with numbers and already have a solid grasp of odds calculation and the bookmaker market, you might not need the course book. It’s designed to teach punters about odds calculation, various statistical methods, and other crucial concepts to help them understand and use Cluster Tables effectively.
However, if you’re not confident in your understanding of these concepts, the “Fundamentals of Sports Betting” course book can be a game changer. It breaks down odds calculation, statistical techniques, and financial terms in a structured, step-by-step manner, allowing you to make the most of Cluster Tables.
The course book is an excellent foundation for building sound betting strategies. It covers vital topics that help you make informed decisions and spot value bets with ease.
So, while it’s possible to grasp Cluster Tables without the course book if you’re already well-versed in the necessary skills, many bettors will find the comprehensive approach in the “Fundamentals of Sports Betting” course book incredibly helpful. It’s an invaluable resource that can elevate your betting game and boost your potential winnings. If you struggle with complex statistical concepts, this book could be your key to success with Cluster Tables.
The Over Under Cluster tables have been developed exclusively for Over/Under goals bets.
You can use them to identify value bets, compile portfolios for the Over/Under market, predict odds movements in the ante-post market, and even for trading, as you can estimate the total number of goals expected in a game. However, they are not suitable for any other markets.
Absolutely! The Cluster Tables provide a wealth of data and statistical analysis that can be used to create your own betting model. The course book teaches you how to use the Cluster Tables effectively and provides examples and exercises to help you understand the underlying concepts.
However, the real world is far more complex and imaginative, and you can certainly develop your own unique betting model(s) utilizing the Cluster Tables.
Your model could focus on pre-match betting, kick-off betting, trading, last-minute betting, or any other approach that suits your preferences and betting style. The limit is truly your own imagination and creativity in applying the data from the Cluster Tables to your betting strategies.
You can use the Cluster Tables for various purposes, as they provide you with the probabilities of the most likely 90-minute results.
However, in-play betting is an entirely different matter, as it requires adjusting your strategies based on the ongoing match dynamics and real-time events. In-play betting focuses on capitalising on the changing odds and circumstances within the game itself. Therefore, no, the tables are probably not suitable for in-play betting.
However, the Cluster Tables may be useful for trading, as you can apply the knowledge of calculating probabilities to both half-time and full-time goals markets. For example, you could back Over 2.5 goals during the first half or before kick-off and then lay that bet as soon as the first goal has been scored.
Yes, you can! 
For example, you can ‘guesstimate’ the direction of odds movements prior to kick-off. Let’s take a closer look at this with an example game, West Ham vs. Stoke on 16/4/2018.
Here’s a screenshot calculating the ‘Zero’ odds just by using the home & away statistics of the two teams but, at this stage, without using the HO/AO clusters:
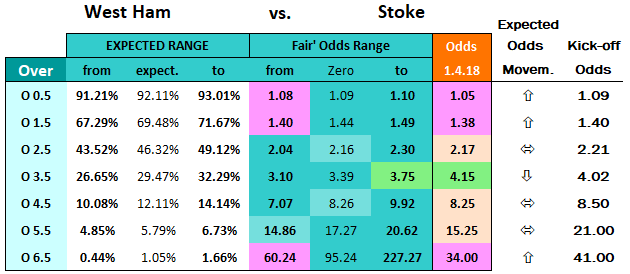
West Ham vs Stoke – expected odds movements 16.4.18
As you can see, all of the odds moved in the expected direction. However, please be aware that this doesn’t happen every time. This match was an exceptional example with all prices (odds) moving in the ‘right’ direction. Therefore, if you are going to develop a strategy trading on odds movements prior to kick-off, you’ll need to have a stop-loss mechanism in place should the odds move in the wrong direction.
Another trading scenario is to use the knowledge of how a match is expected to finish after 90 minutes to make an informed betting decision at half time. This time, you have to use the calculations that take the HO/AO quotient into consideration:
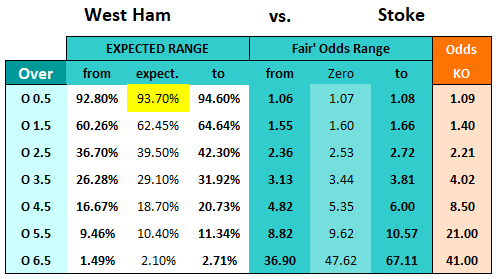 West Ham vs Stoke – odds calculation using HO/AO quotient – 16.4.18
You can see that the expected probability for this game (in 90 minutes) having over 0.5 goals was 93.7%. Even though it may challenge a few preconceived ideas about probabilities, you must understand that at half-time, when the score was 0-0, the probability for the match ending with over 0.5 goals was still 93.7%!!
Even though the match had already reached half-time, the overriding probability for one goal hadn’t changed. However, the odds for over 0.5 goals had certainly changed – the price would have risen, not by a huge amount, but enough to turn the bet into a lucrative value bet.
At kick-off, the odds matched the zero odds expectations at 1.09 (first screenshot: without HO/AO clusters) and were just slightly above the expected range of ‘fair odds’ (second screenshot: taking the HO/AO clusters into consideration), but at half-time, they were around 1.20 and therefore contained very healthy value.
Just as a side note, there were two goals scored in the second half of this match.
Of course, there are many other benefits that the Cluster Tables offer to traders. Being able to estimate pretty accurately the probabilities of the total number of goals in 90 minutes is immensely useful for many trading decisions!
By purchasing the Cluster Tables for the current season, you automatically subscribe to receive updates. The renewal date of the subscription is set so that the tables will be published a couple of weeks before the respective league starts.
You will receive an email as soon as the new download is available, and you can also download it from ‘My Account’ in our shop.
You can ask your questions via the comment function below or on any other article on Soccerwidow. We typically reply within a few hours, and our response will be sent directly to your inbox, so you don’t need to keep checking.
Moreover, if you subscribe to a post that interests you, you will also receive questions and replies from other readers who have posted on the same article, in addition to our responses.
Please try to find an answer to your question using the search function before posting it. There are hundreds of articles to read and acquire knowledge from.
If you cannot find a satisfactory answer to your question, please post your question in the closest corresponding article on the topic.
In the gambling world, understanding odds is crucial. ‘True’, ‘fair’, or ‘zero’ odds are terms used interchangeably to describe odds that accurately represent the statistical expectation of an event.
For example, the ‘true’ odds for a coin toss are 2.0 (evens) since the probability of landing heads or tails is precisely 50/50.
Fair odds or ‘zero’ odds are essential for finding ‘value’ in bets. If every bet were placed at ‘zero’ odds, the outcome of any number of bets would be a ‘zero’ sum game.
Zero odds are used as a reference point to determine whether a bet represents a value bet opportunity or not. Prices offered above zero odds indicate value back bet opportunities, while prices below zero odds suggest value lay bet opportunities.
Zero odds play a vital role in assessing the accuracy of bookmakers’ prices and identifying temporary or lasting pricing ‘errors’ caused by demand and supply fluctuations. Once the Zero odds are known, it becomes possible to evaluate whether a bet represents a value bet opportunity.
The higher the odds obtained above zero odds, the more profitable your long-term back bet portfolio should be. Conversely, the lower the odds obtained below zero odds, the more profitable your long-term lay bet portfolio should be.
The entire course book “Fundamentals of Sports Betting” is about distribution, deviations, the range of expected probabilities, and converting them into Zero-odds.
The Cluster Tables are called cluster tables because they group matches according to their HO/AO quotients for more precise calculations.
Explaining exactly how to calculate Zero-Odds using the Cluster Tables is impossible in just a few words, as the course book dedicates dozens of pages and countless exercises to this topic.
The division of HO (Home Odds) by AO (Away Odds) reflects the “strength” of the teams perceived by the public, making upcoming games comparable with past matches with known results.
When building the quotient, we’re not asking ourselves, “Are these teams really equal?” or, “Is the favourite priced correctly?” We don’t check the 1×2 odds at all; instead, we simply use market prices and assume that the bookmakers have taken statistics and public opinion (e.g., team ranking) into account as accurately as possible when setting their odds.
The HO/AO quotient is, therefore, an ideal method for comparing an upcoming match with the nearest batch of equivalent games against teams of similar perceived strength to the opponent under analysis.
When examining the tables in the Bundesliga for any team, the following categories become apparent when dividing games into ‘perceived strength’:
HO/AO: up to 0.2918
The home team is the clear favorite with a very good chance of winning (the weight of money makes the home team the overwhelming favorite).
HO/AO: 0.2919 to 0.5292
The home team is stronger than the away team, but there is also a good chance of a draw in the game (fluctuating opinion between home or draw).
HO/AO: 0.5293 to 0.7830
It is not really clear in which direction the game will develop (no overwhelming favorite).
HO/AO: 0.7831 to 1.3172
The chance of a draw is quite high as both teams are perceived to be of equal strength (no overwhelming favorite).
HO/AO: over 1.3173
The home team is perceived as being much weaker than the away team; the public feels that it could be an away win (the perceived favorite is the away team).
Take any Bundesliga weekend and cluster the matches according to the above HO/AO quotients (before kick-off) and check against the distribution of results. You will see that they hardly distribute according to the expectations (HO/AO clusters). That’s what makes 1×2 betting so very tricky. However, there is a strong correlation between the HO/AO quotients and the observed O/U results!
Unfortunately, the explanation is not short or sweet enough to fit into an answer in the FAQs section. You’ll just have to trust that the HO/AO quotient is a crucial factor when judging if O/U odds contain value or not, and of course, you’ll find lengthy explanations in the course book.
The Cluster Tables utilize odds recorded near or at the end of the ante-post betting market, minimizing the impact of heavily inflated odds on the HO/AO quotient.
Most Cluster Tables employ odds from Pinnacle, a well-known low-margin bookmaker, or the highest bookmaker odds from a panel at www.Oddsportal.com. By using odds close to kick-off time, we reduce the influence of inflated odds.
For tables using Pinnacle odds, you should check the odds Pinnacle is offering at the time of your analysis to determine the applicable HO/AO quotient for your chosen match.
For tables using Oddsportal’s highest odds, you need to exclude bookmakers that typically have inflated odds. 1×2 odds don’t change drastically before kick-off, so the timing of your analysis is not critical. The HO/AO quotient rarely changes closer to kick-off.
Unfortunately, no.
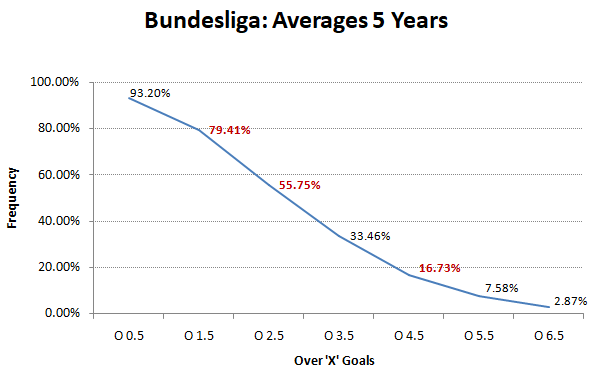
Here’s a screenshot for the German Bundesliga Over ‘X’ Goals averages for five seasons:
And here’s a screenshot for five teams (playing in all five of those seasons) and their respective frequencies of Over ‘X’ goals:

You can clearly see that the frequencies for different teams vary significantly.
Please look closely at the Over 1.5 Goals:
Wolfsburg, with the highest frequency of 88.24%, is still lower than the Bundesliga average frequency (93.2%).
How can this possibly be? The explanation is the overwhelming influence of Bayern Munich’s performance. Here’s another screenshot:
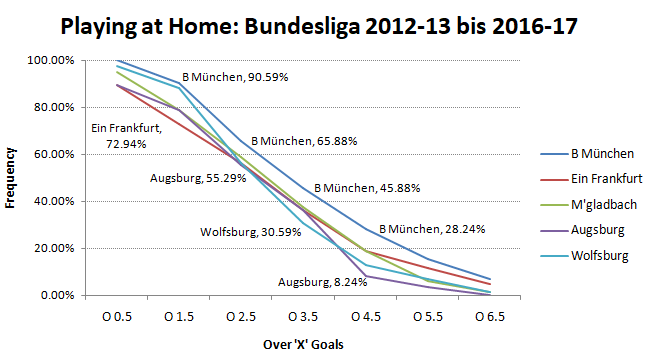
Bayern’s results tend to skew the Bundesliga averages and ‘correct’ them to a level no other team achieves if looked at individually. Have a look at the Over 4.5 Goals curve: Bayern achieved 28.24% during the period shown, while Augsburg, for example, achieved only 8.24%.
To reiterate, it is not advisable to take the league average as a benchmark for deciding whether or not value exists in any given match. Even if you remove Bayern from the Bundesliga statistics, the results will be skewed by the next most extreme outlier, and so on. And unfortunately, this is the case in any league, not just in Germany.
League averages should never be a benchmark for any betting decision, neither in the Over/Under goals market nor in any other betting market. League averages contain all matches: those between very strong favorites and poorly performing outsiders; matches between equally strong teams, etc.
Any team’s performance is entirely different from another team’s performance: every football fan knows this.
Just because ‘on average’ the probability for over 2.5 goals is 52.58% (e.g., the EPL), it doesn’t necessarily follow that every match has a minimum (or maximum) probability of 52.58% (odds 1.90) as well.
For example, the match Manchester United against Liverpool on 10th March 2018 had a ‘true’ probability of 62.50% (odds 1.60) to finish with over 2.5 goals. The highest over 2.5 goal odds at kick-off for that match were 2.00 and therefore it was a ‘value’ bet, but not because the odds were ‘above the league average’ but because they were above the expected ‘zero’ odds for that individual match.
On the other hand, the match West Ham vs. Stoke on 16th April wasn’t a ‘value’ bet although the over 2.5 goals odds were 2.21, well above the league average (1.90). However, using the Cluster Tables and calculating the ‘true’ probability for that game (according to their HO/AO cluster) the probability was actually only 39.50% (in odds: 2.53) and therefore well under-priced.
As a side note, Man Utd vs Liverpool finished with three goals (2-1) and West Ham vs Stoke with two goals (1-1). The ‘Over 2.5 goals’ bet for Man Utd vs Liverpool had a probability of 62.5% to win and the ‘Under 2.5 goals’ bet had a probability of 60.5%. That’s the reason why these two examples were chosen.
At the time of writing these FAQs, I was especially concentrating on EPL matches that had a probability of over 60% in the O/U 2.5 goals market. That both randomly chosen example games finished ‘statistically correct’ was a lucky stroke as there was also a good 40% probability in both cases that they wouldn’t.
If you want to quickly calculate odds for various betting markets and already have a good statistical knowledge and understanding, the Value Calculator is sufficient.
However, if you’re not familiar with mathematical terms like ‘deviation’, ‘range’, ‘median’, or find it challenging to judge if prices (odds) are fair, you should consider the course book (not the Cluster Tables at this stage! They are an auxiliary product to the coursebook – You won’t be able to utilize them to their full potential without having worked through the course).
The Cluster Tables accompany the Odds Calculation Course and relate directly to its teachings. The betting tables within the Cluster Tables group the Over/Under bets into their correlation (mutual relationship or connection) with the perceived strength of the teams.
This being the case, they are much more accurate than the Value Calculator, but to fully understand why, you’ll need to purchase the Course.
Furthermore, the Cluster Tables require minimal data input, while the Value Calculator requires gathering data manually and inputting it for the last 25 matches for both teams (plus the respective head-to-heads) for every match you wish to analyse.
On the other hand, the Value Bet Detector estimates the probabilities for many more bet types and not just for the Over/Under goals. It provides an excellent rough guide to whether there is any value in the odds on offer in over sixty different betting markets (1X2, Over/Under, Correct Score, etc.).
Summary:
If you are looking to estimate the probabilities of many bet types, choose the Value Calculator. However, if you prefer a deep-dive approach to true value betting and want to use the market dynamics of the bookmaker market to your advantage, then you should consider betting on Over/Under goals utilising the Cluster Tables.